It’s been three years since our last Elementor speed test. There was some huge updates in the Elementor plugin for this period so it is time to make one more speed test in the 2023.
We have developed our experimental micro WordPress theme which is called Ex that has no JavaScript at all and loads only one 5kB CSS file so we could check and see any other assets clearly. The Ex theme also has some cool settings that helps to remove Gutenberg CSS files, remove gutenberg inline css, remove gutenberg duetones svg markup, remove emoji scripts and styles and disable block editor for widgets screen. Lets activate all these options so we could perform our speed tests clearly:
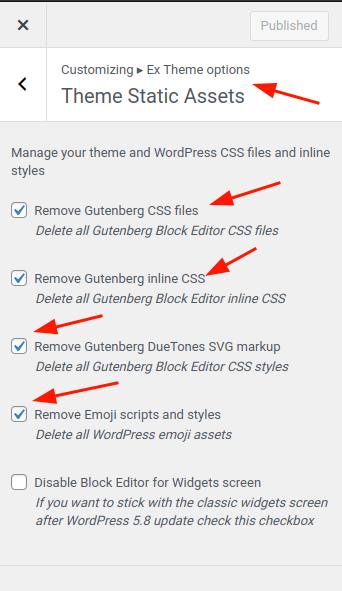
By the way, if you’re interesting in the Ex theme, feel free to to reach us. You can find links to the live demo site with this theme and these demo test data at the end of this post in the ‘Server side performance’ section.
Prepare WordPress for the speed test
We have created our demo WordPress installation with the Ex theme so you could replicate all our Elementor speed test checks by yourself.
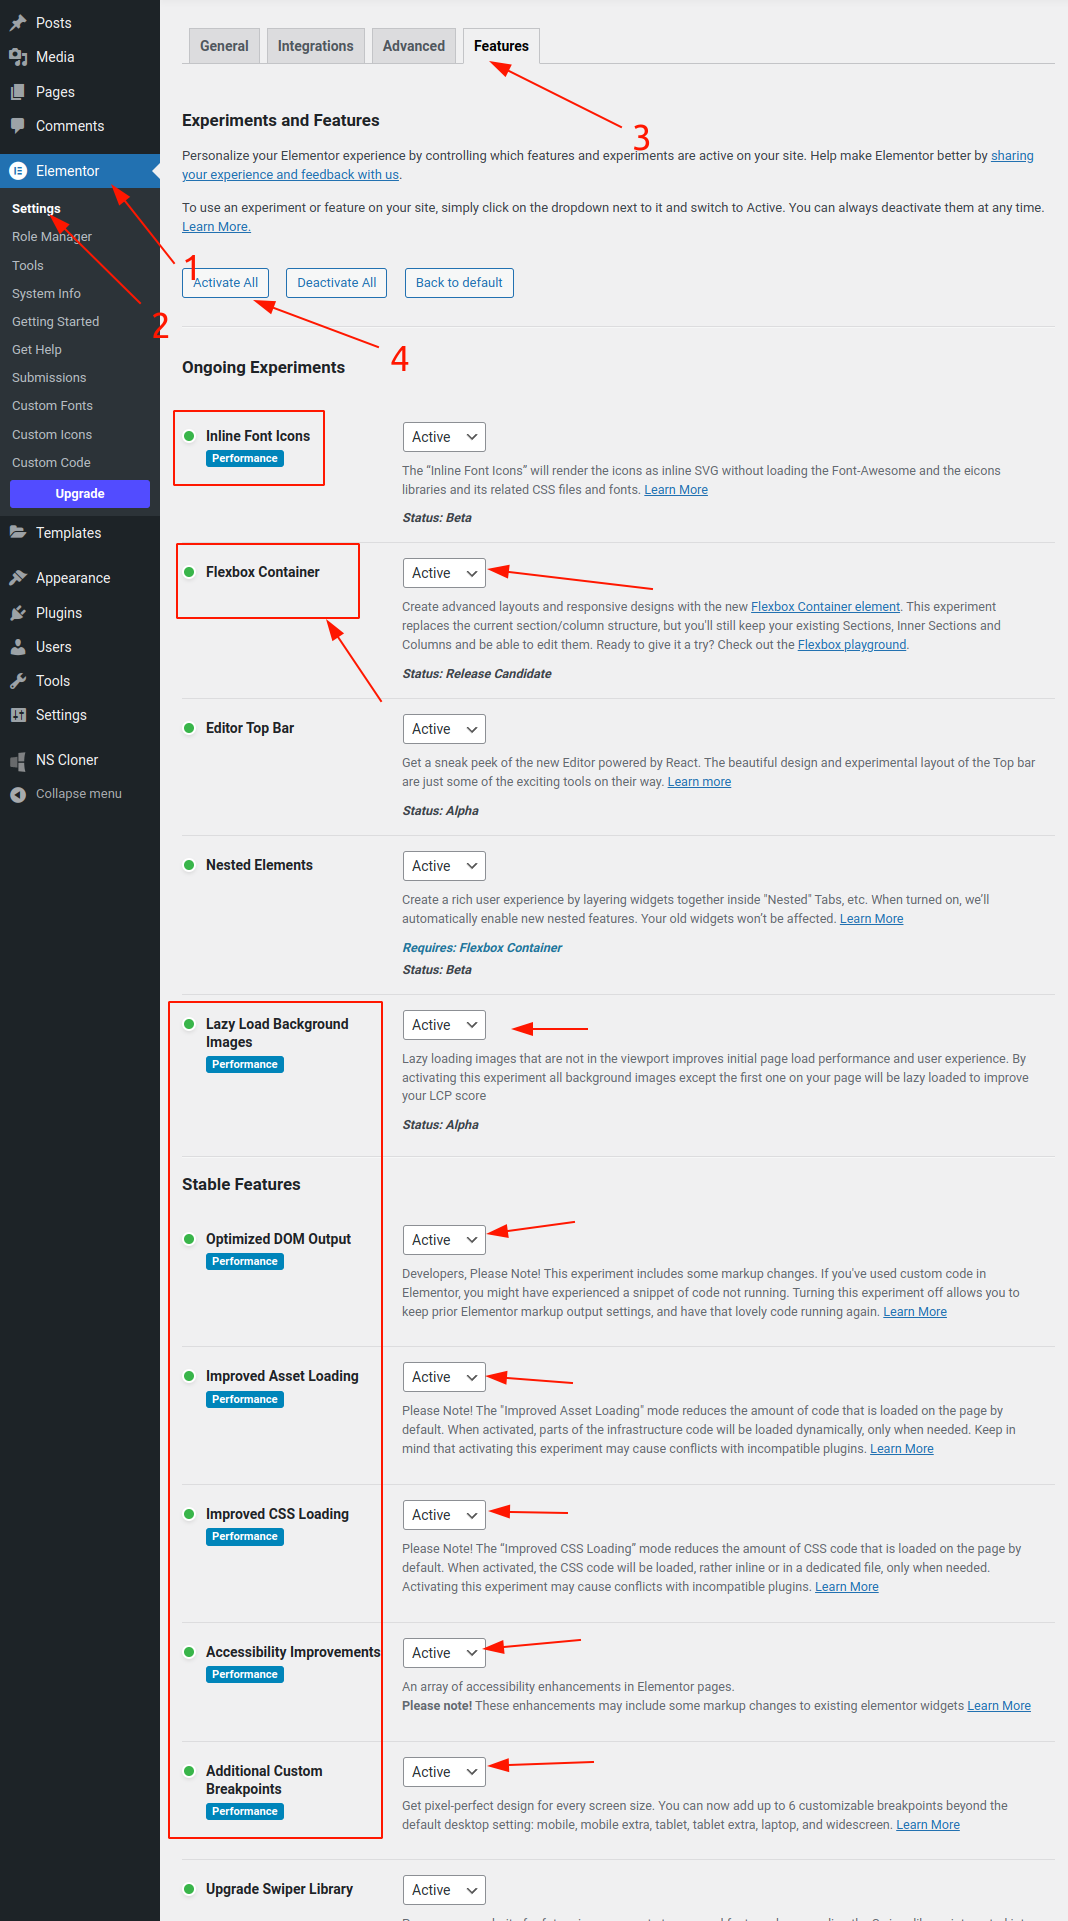
Firs of all, lets install, activate, set up the Elementor plugin and activate all it’s settings that are responsible for the page load speed and performance:
Creating pages for a speed test
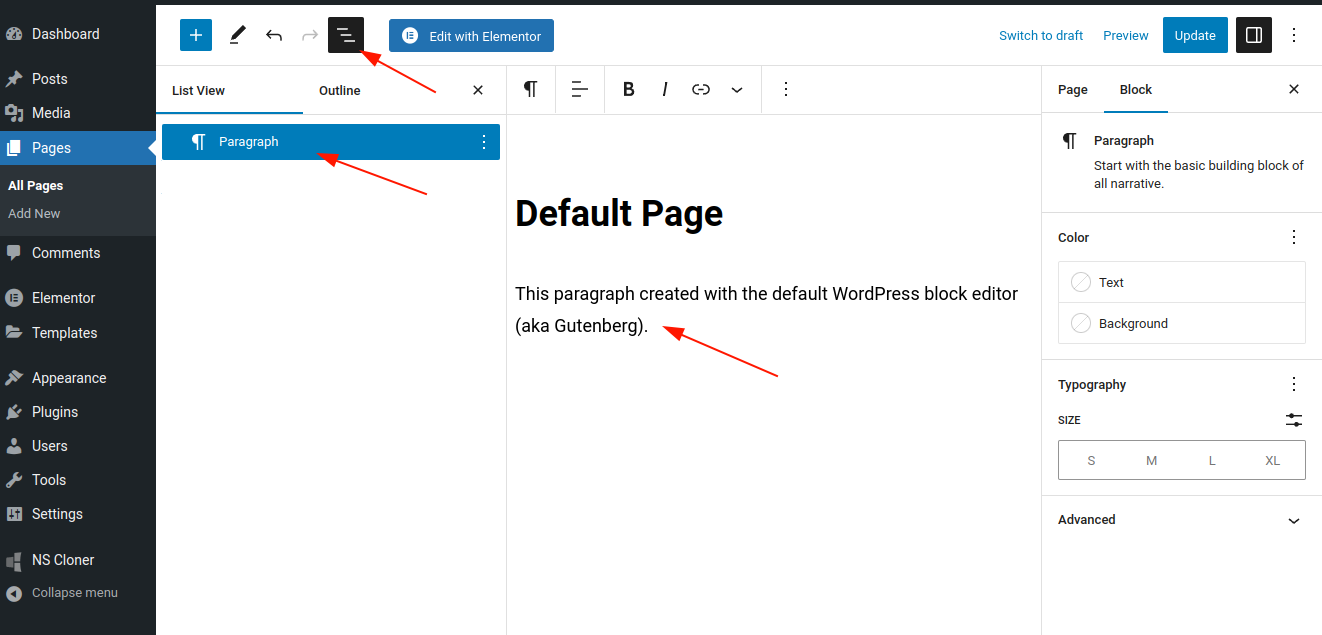
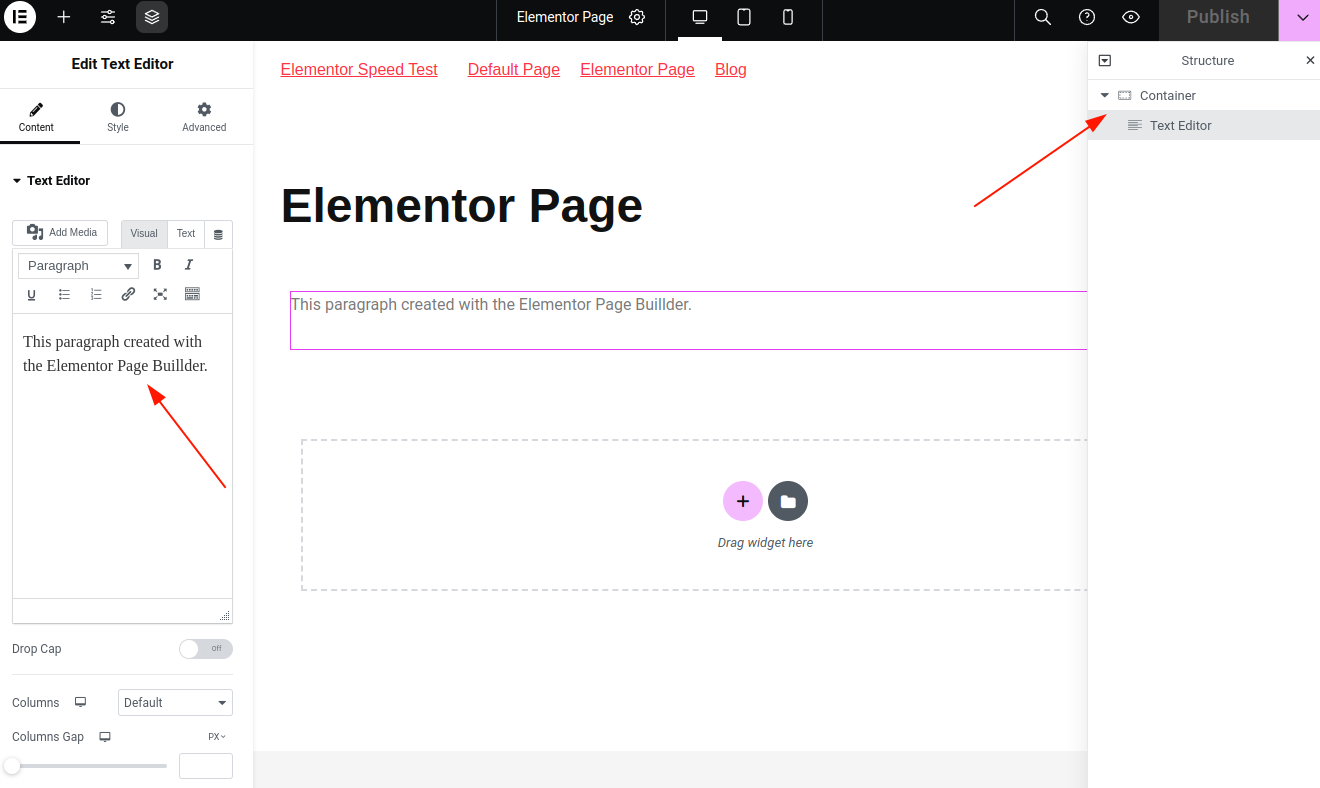
Now let’s create two separate pages. We will need them for our Elementor speed test below. One page will be created with the default WordPress editor, and the other page will be created with the Elementor page builder.
Both of these page will only contain one single paragraph so we could compare them easily.
1. Simple page with paragraph:
2. Elementor page with paragraph:
Default and Elementor pages comparison
It is time to compare our newly created pages HTML markup, assets and loading performance. We will use the Chrome developer tools for our speed tests in the way that we have described earlier.
Default page
Let’s navigate to our simple page, open browser developer and check our ‘Elements’ tab:
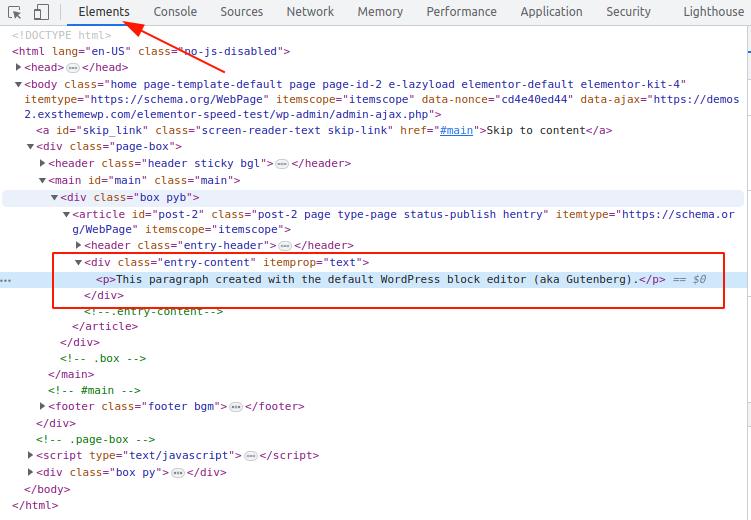
As you can see – there is clean one single paragraph without any extra div wrappers, which is very good for SEO purposes and for a page loading parsing and displaying in the browser.
Now let’s check our default page static assets number and size, HTTP requests number and loading time. We need to switch to the ‘Network’ tab (1), check the ‘Disable cache’ checkbox (2), make sure that we’re looking on all (3) our network staff and refresh the page.
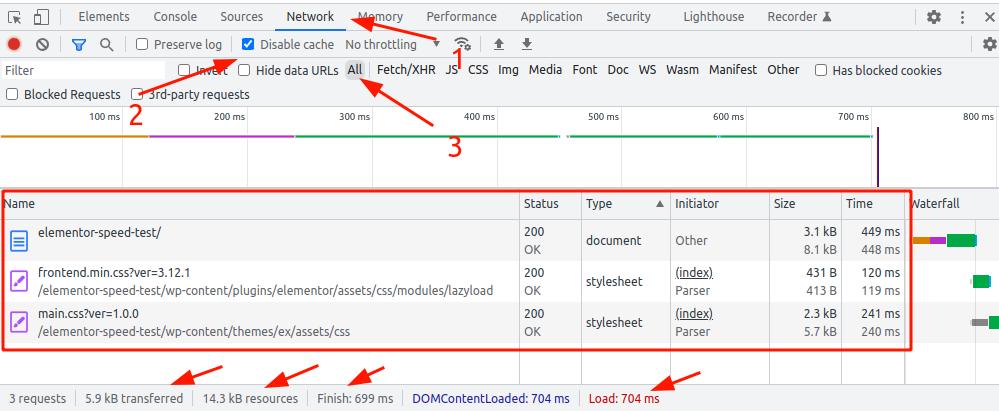
As you can see, there is only trhee HTTP requests – one for the HTML page itself, one for the theme’s CSS file and one coming from the Elementor plugin even if the page does not builted with it. Page is loaded for 699ms and has 14.3 kB of resourse.
Elementor page
It is time to go to our Elementor page that we have created earlier and test it. First of all let’s take a look on the ‘optimized’ HTML markup. As you remember, we have activated the ‘Flexbox container’ and the ‘Optimized DOM output’ earlier when we had set up the Elementor plugn. So here is an ‘optimized’ HTML markup:
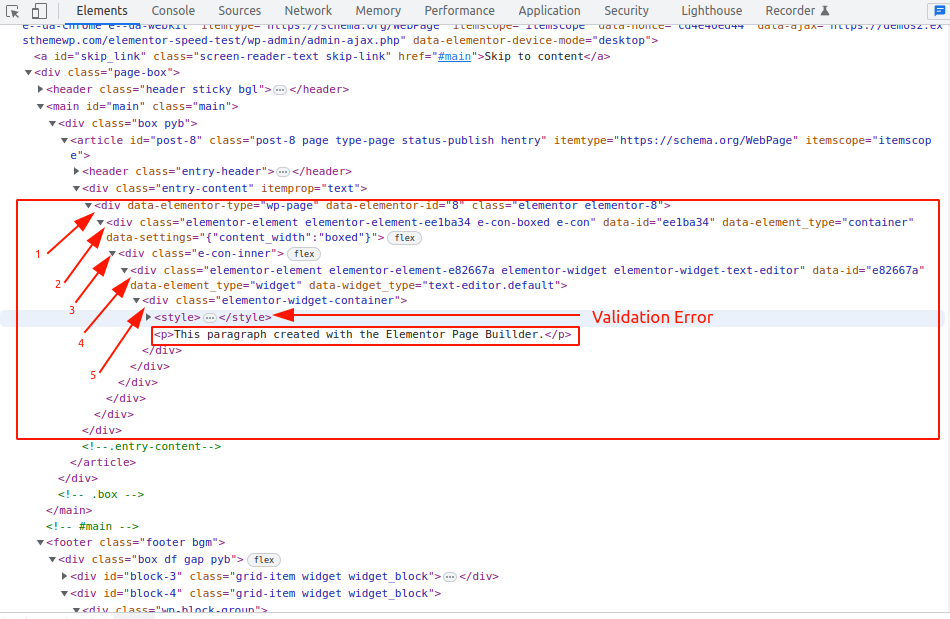
As you can see, there are five extra DIV tags that are wraps our one single paragraph ot text. By the way, there is also a ‘style’ tag near our paragraph that is not valid HTML markup:

And now let’s switch to the developer tools ‘Network’ tab to check the Elementor page static assets number and size, HTTP requests number and loading time:
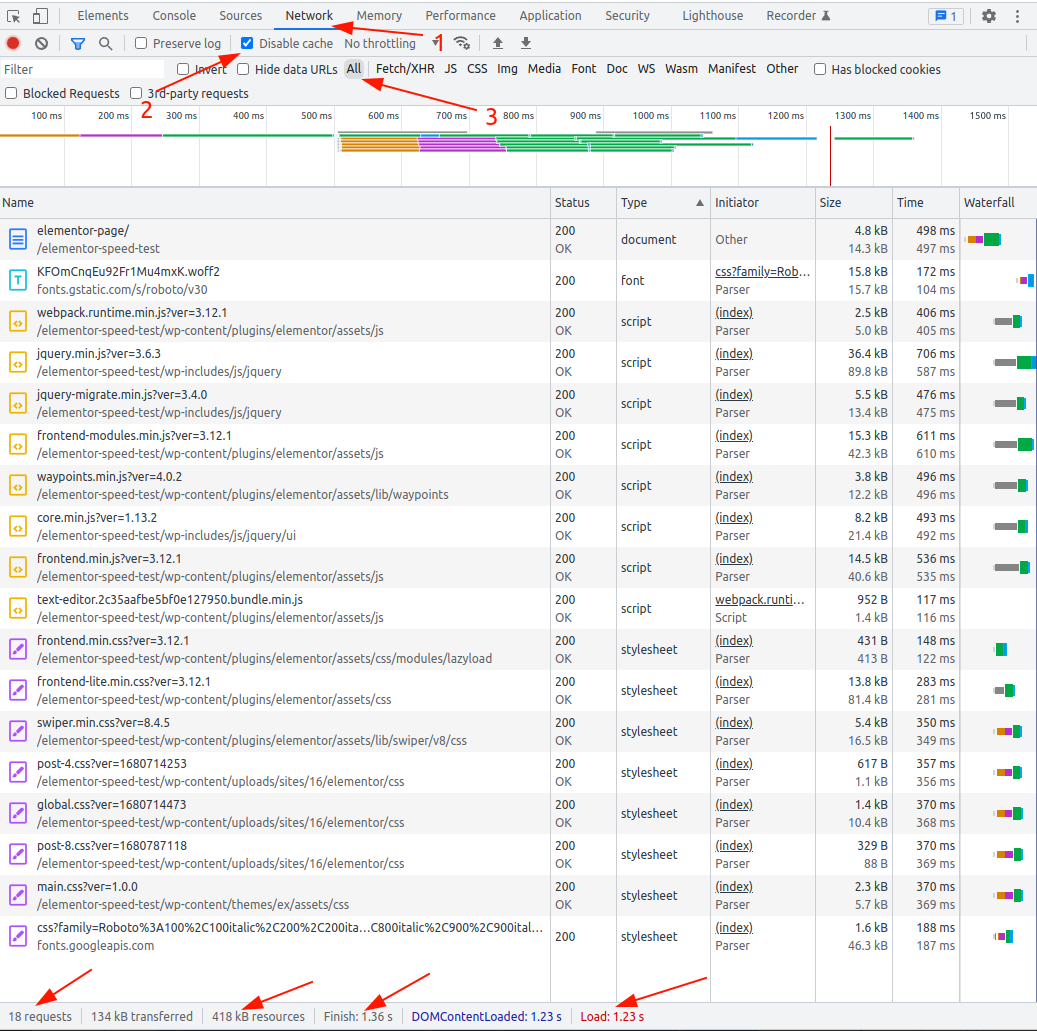
As you might see, there are 18 HTTP requests (which includes 8 JavaScript files including jQuery and 7 CSS files: 6 times bigger than our simple page), 418 kB resources (28 times bigger). Page is loaded for 1.36s which is almost twice bigger than our simple page.
Lighthouse speed test comparison
Now let’s test our test pages using Developer tools built-in LightHouse page speed functionality. We have described the Lightouse speed test method earlier as well.
First, lets go to the DevTools ‘Lightouse’ tab and test our simple page. Let’s test it for mobile devices because it is more important nower days.
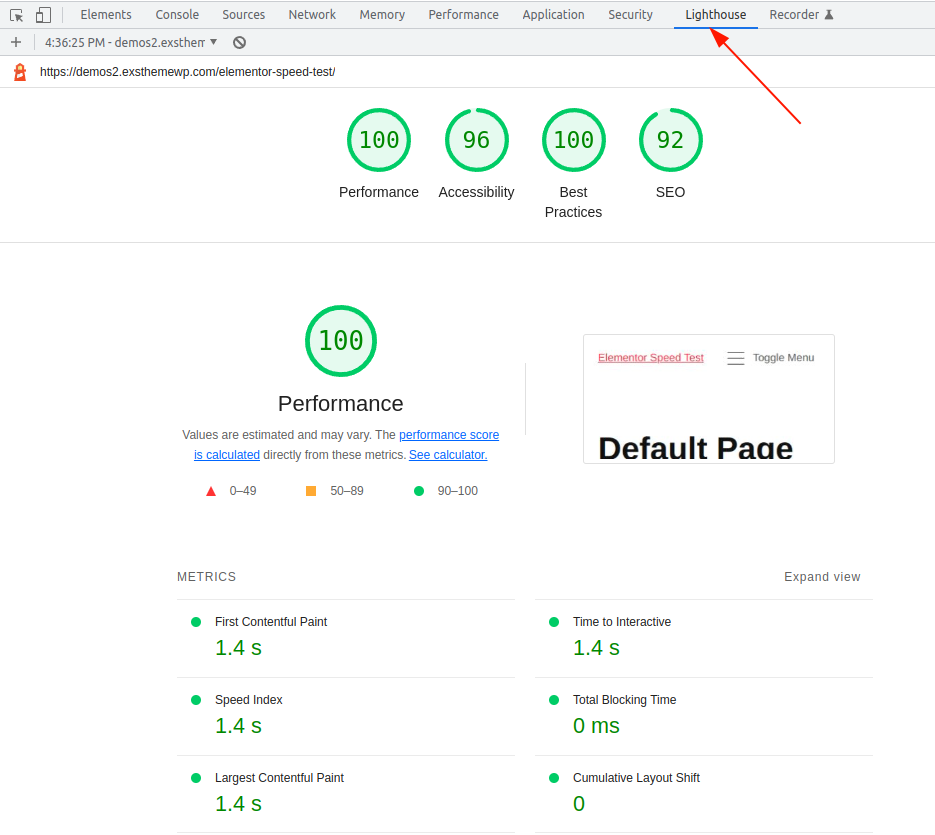
As you can see – it has 100% performacne score and time to interactive is 1.4 seconds.
It is time to check our test Elementor page in the same way:
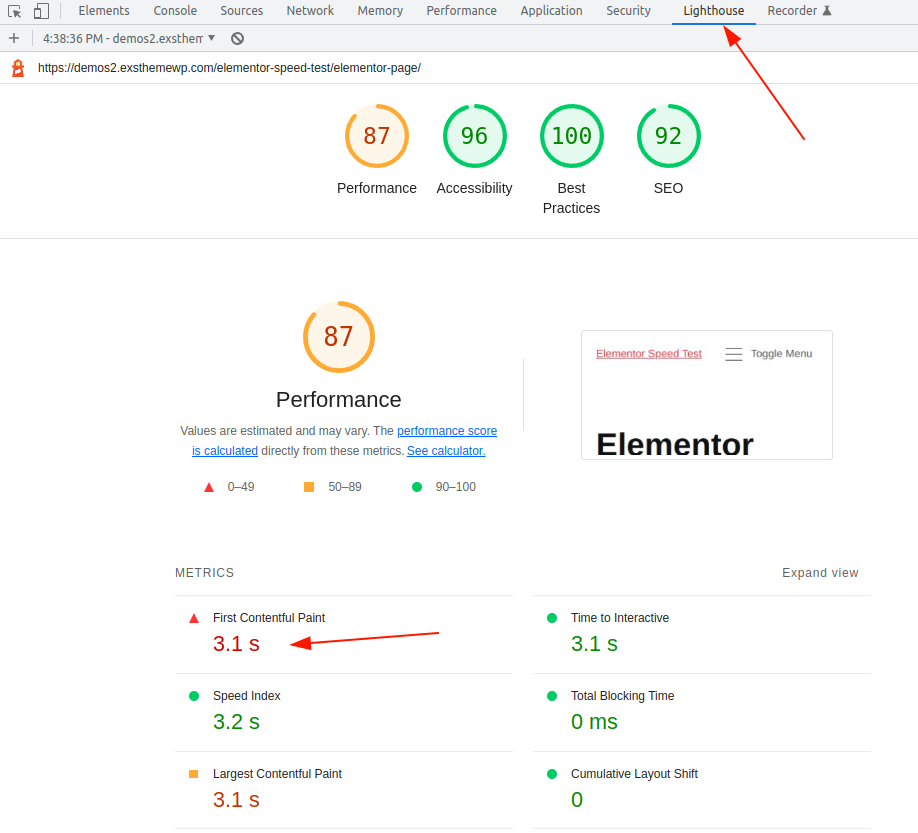
As you may see – the Performance score is 87 which is not bad actualy. But the time to interactive is 3.1 seconds which is more than two times bigger than the simple page.
Server side performance
As you can see at the very bottom of the our demo Default page and the Elementor page, there is ‘Memory used’ info. It shows how many bytes of RAM WordPress spends to display these pages.
For the Default page it is lower than 13 MegaBytes, but for the Elementor page it is near 18.3 MegaBytes, which is in about 40% bigger.
Conclusion
Elementor is a great tool for many people who don’t know how to code. It is also helps to create very impressive web page designs with only drag and drop workflow.
But when it comes to the performance and SEO – it is not so great as it might seems for the first look.
If you need a professional fastest WordPress theme which can help you to build your WordPress site without any 3rd party plugins and dependencies – please check our ExS theme which was created specially for these purposes.
If you need a professional help to create your fast, SEO friendly website – please contact us.


